Compare balance graphically of a continuous covariate as part of a PSA
Source:R/box.psa.R
box.psa.RdGiven predefined strata and two level treatment for a continuous covariate
from a propensity score analysis, box.psa draws pairs of side by side
boxplots corresponding to control and treatment for each stratum.
box.psa(
  continuous,
  treatment = NULL,
  strata = NULL,
  boxwex = 0.17,
  offset = 0.17,
  col = c("yellow", "orange", "black", "red", "darkorange3"),
  xlab = "Stratum",
  legend.xy = NULL,
  legend.labels = NULL,
  pts = TRUE,
  balance = FALSE,
  trim = 0,
  B = 1000,
  ...
)
Arguments
- continuous
Vector or N X 3 dataframe or matrix. If a vector, then represents the quantitative covariate that is being balanced within strata in a PSA. If
continuoushas three columns, then the second and third are assumed to be thetreatmentandstratarespectively. Missing values are not allowed.- treatment
Binary vector of same length as
continuousrepresenting the two treatments; can be a character vector or factor.- strata
A vector or factor of same length as
continuousindicating the derived strata from estimated propensity scores. May be numeric or character vector, or factor. Strata are ordered lexicographically in plot.- boxwex
Numeric; controls width of boxes. Default = 0.17
- offset
Numeric; controls distance between the two boxes in each stratum. Default = 0.17
- col
Default =
c("yellow", "orange", "black", "red",
"darkorange3")
. Color vector for the control boxes, treatment boxes, and line connecting their means.- xlab
Label for the x-axis; default =
"Stratum". Other standard labels may be used as well.- legend.xy
Binary vector giving coordinates of the legend. By default the legend is placed to the top left.
- legend.labels
Vector of labels for the legend; default is essentially
c("Treatment (first)", "Treatment (second)", "Treatment Means
Compared", "KS p-values", "Strata-Treatment Size")
where treatment names are taken fromtreatment. Vector has four elements ifbalance = FALSE, ommitting "KS p-values".- pts
Logical; if
TRUEthen (jittered) points are added on top of the boxplots.- balance
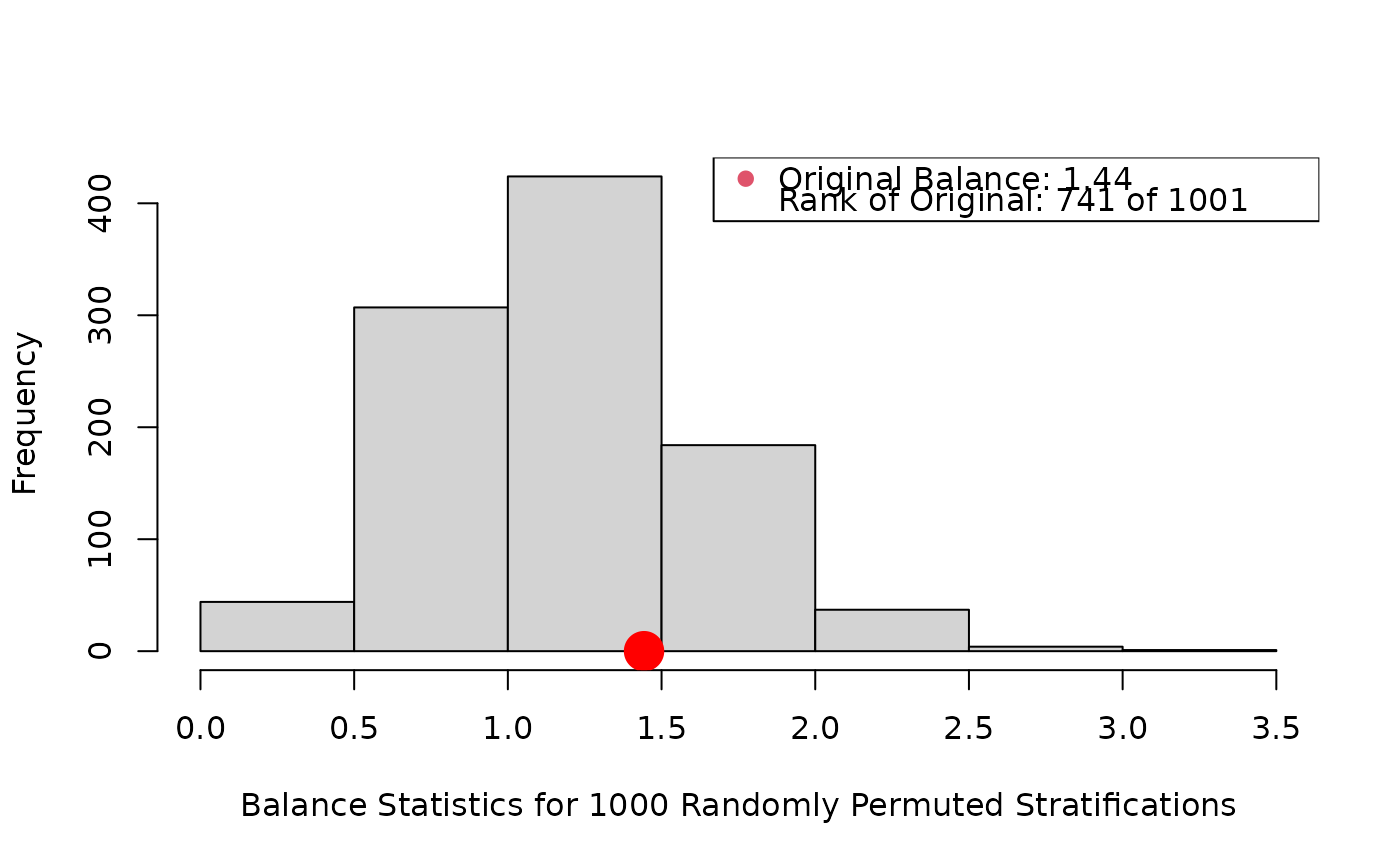
Logical; if
TRUEthenbal.ms.psaprovides a histogram of a permutation distribution and reference statstic to assess balance across strata;bal.ks.psaadds p-values to the graph derived from 2-sample Kologmorov-Smirnov tests of equivalence of control/treatment distributions within each stratum.- trim
If
balance=TRUE, defines fraction (0 to 0.5) of observations to be trimmed from each end of stratum-treatment level before the mean is computed. Seemean,bal.ms.psa.- B
Passed to
bal.ms.psaif necessary, determines number of randomly generated comparison statistics. Default =1000.- ...
Other graphical parameters passed to
boxplot.
Details
Draws a pair of side by side boxplots for each stratum of a propensity score analysis. This allows visual comparisons within strata of the distribution of the given continuous covariate, and comparisons between strata as well. The number of observations in each boxplot are given below each box, and the means of paired treatment and control groups are connected.
See also
bal.ks.psa, bal.ms.psa, cat.psa
Examples
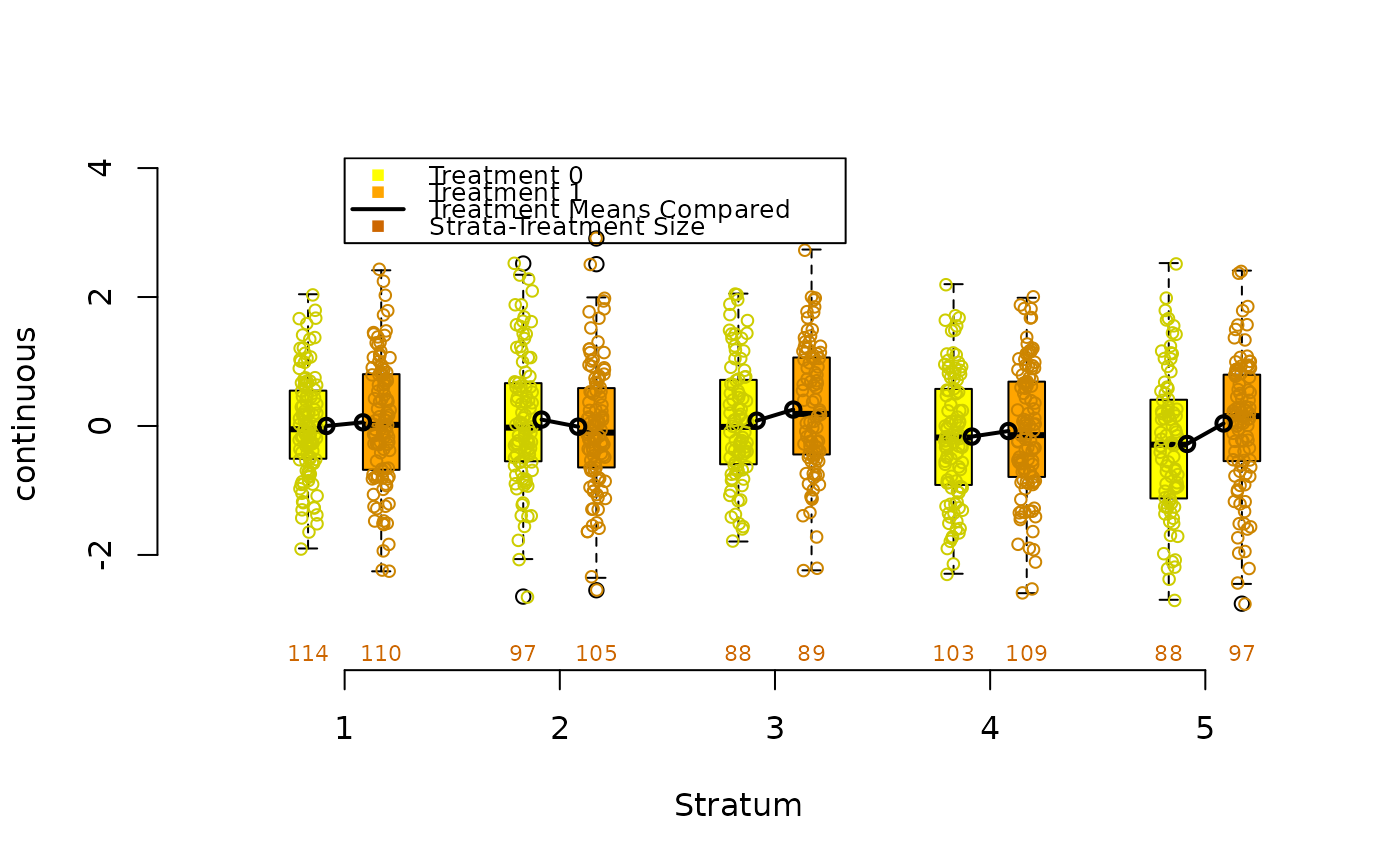
continuous<-rnorm(1000)
treatment<-sample(c(0,1),1000,replace=TRUE)
strata<-sample(5,1000,replace=TRUE)
box.psa(continuous, treatment, strata)
#> Warning: NAs introduced by coercion
#> Warning: NAs introduced by coercion
 data(lindner)
attach(lindner)
lindner.ps <- glm(abcix ~ stent + height + female +
diabetic + acutemi + ejecfrac + ves1proc,
data = lindner, family = binomial)
ps<-lindner.ps$fitted
lindner.s5 <- as.numeric(cut(ps, quantile(ps, seq(0, 1, 1/5)),
include.lowest = TRUE, labels = FALSE))
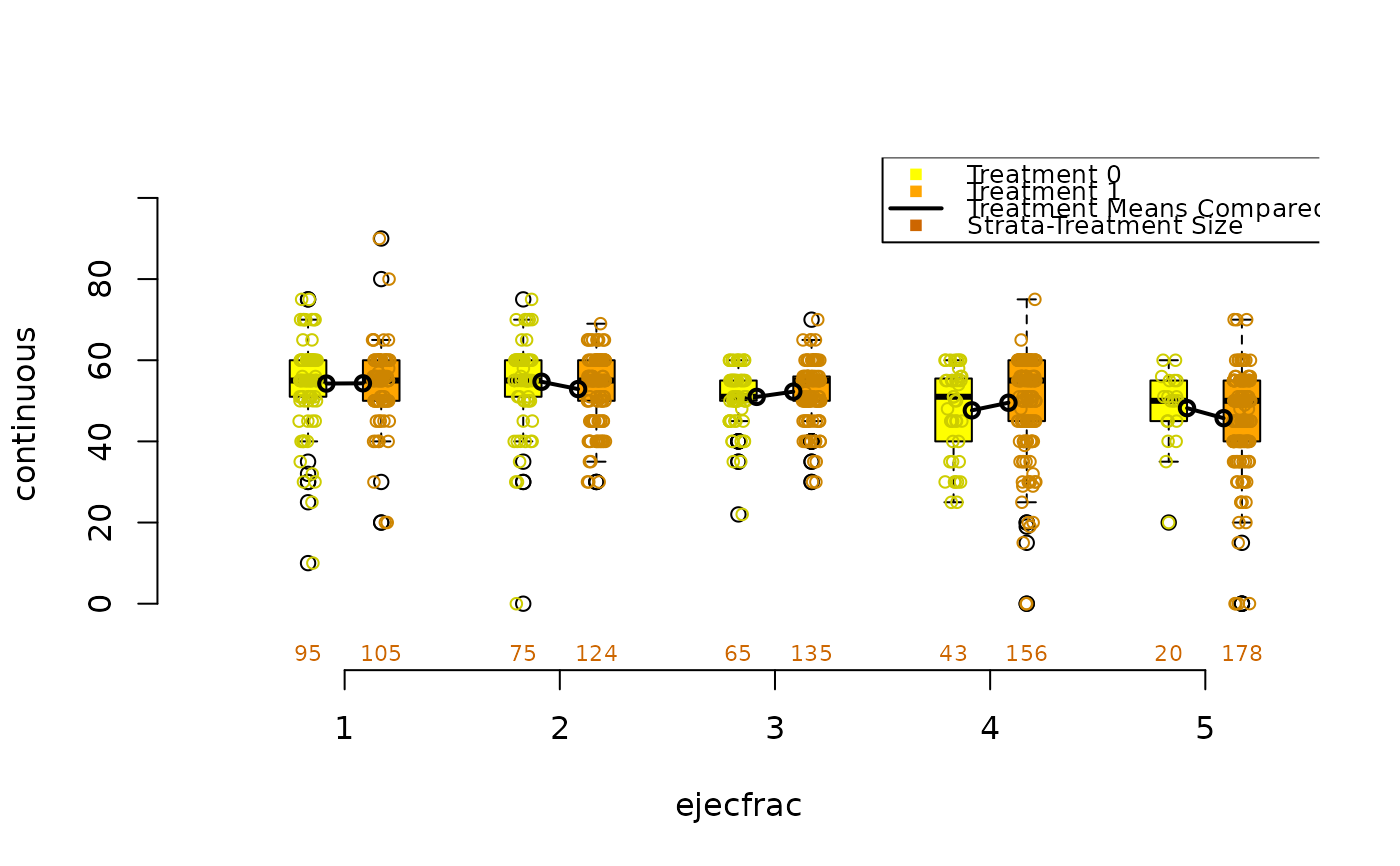
box.psa(ejecfrac, abcix, lindner.s5, xlab = "ejecfrac",
legend.xy = c(3.5,110))
#> Warning: NAs introduced by coercion
#> Warning: NAs introduced by coercion
data(lindner)
attach(lindner)
lindner.ps <- glm(abcix ~ stent + height + female +
diabetic + acutemi + ejecfrac + ves1proc,
data = lindner, family = binomial)
ps<-lindner.ps$fitted
lindner.s5 <- as.numeric(cut(ps, quantile(ps, seq(0, 1, 1/5)),
include.lowest = TRUE, labels = FALSE))
box.psa(ejecfrac, abcix, lindner.s5, xlab = "ejecfrac",
legend.xy = c(3.5,110))
#> Warning: NAs introduced by coercion
#> Warning: NAs introduced by coercion
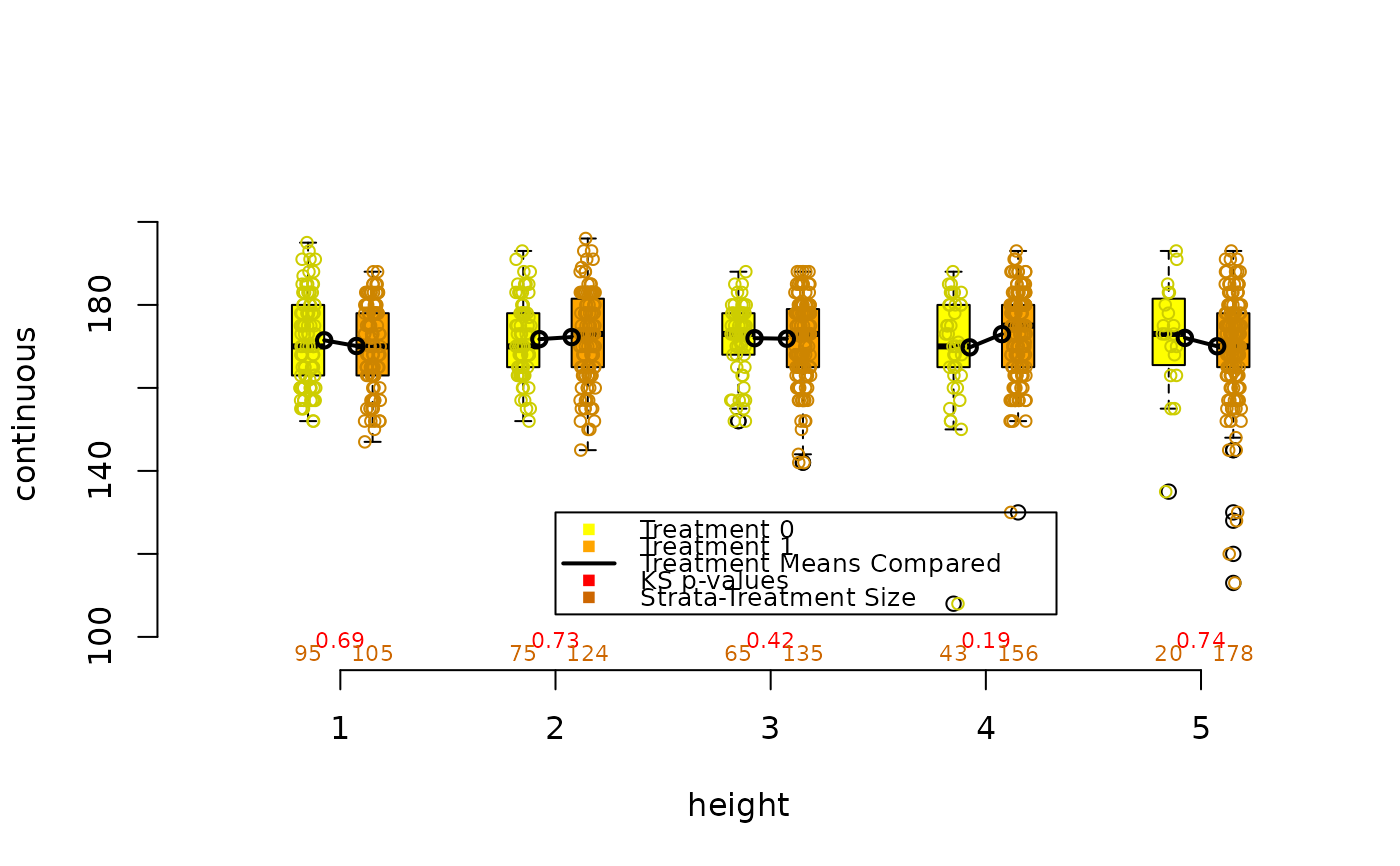
 lindner.s10 <- as.numeric(cut(ps, quantile(ps, seq(0, 1, 1/5)),
include.lowest = TRUE, labels = FALSE))
box.psa(height, abcix, lindner.s10, xlab="height",
boxwex = .15, offset = .15, legend.xy = c(2,130), balance = TRUE)
lindner.s10 <- as.numeric(cut(ps, quantile(ps, seq(0, 1, 1/5)),
include.lowest = TRUE, labels = FALSE))
box.psa(height, abcix, lindner.s10, xlab="height",
boxwex = .15, offset = .15, legend.xy = c(2,130), balance = TRUE)
 #> Press <enter> for bar chart...
#> Warning: NAs introduced by coercion
#> Warning: NAs introduced by coercion
#> Press <enter> for bar chart...
#> Warning: NAs introduced by coercion
#> Warning: NAs introduced by coercion