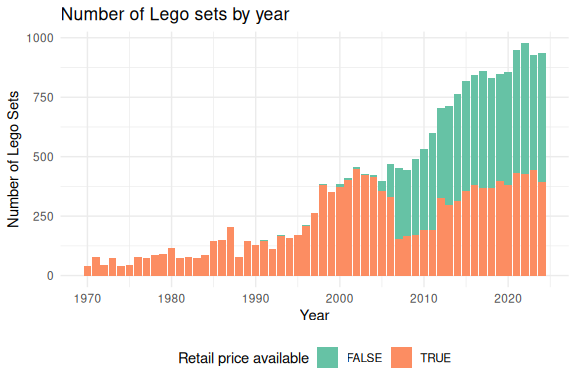
An often stated criticism of Lego is how expensive Lego has become over the years (see here, here, and here). However, there are two ways to consider Lego costs: 1. price per set or 2. price per piece. As shown in Figure 1 the number of Lego sets released each year has increased substantially since 2000. The data for this analysis comes from the Brickset website. For many sets there is no price information available, especially before the year 2000. For more recent years there are several factors leading to missing retail price information including special and promotional sets that may not have has a cost. Regardless, this analysis only uses sets released since 2000 that have a US retail price available. Table 1 provides the relevant summary statistics.

Figure 1: Number of Lego sets by year.
lego_summary <- legosets |>
    dplyr::filter(
        year >= 2000 &
        pieces > 0
        ) |>
    dplyr::mutate(
        price_per_piece = US_retailPrice / pieces,
        valid_set = !is.na(US_retailPrice) & !is.na(pieces)
    ) |>
    # There are some electronic products we want to exclude
    dplyr::filter(is.na(price_per_piece) | price_per_piece < 1) |>
    dplyr::group_by(year) |>
    dplyr::summarise(
        n = dplyr::n(),
        n_valid = sum(valid_set),
        mean_pieces = mean(pieces, na.rm = TRUE),
        sd_pieces = sd(pieces, na.rm = TRUE),
        mean_price = mean(US_retailPrice, na.rm = TRUE),
        sd_price = sd(US_retailPrice, na.rm = TRUE),
        mean_price_per_piece = mean(price_per_piece, na.rm = TRUE),
        sd_price_per_piece = sd(price_per_piece, na.rm = TRUE)
    )
lego_summary |>
    as.data.frame() |>
    mutate(
        mean_pieces = paste0(round(mean_pieces, digits = 2), ' (', round(sd_pieces, digits = 2), ')'),
        mean_price = paste0(round(mean_price, digits = 2), ' (', round(sd_price, digits = 2), ')'),
        mean_price_per_piece = paste0(round(mean_price_per_piece, digits = 2), ' (', round(sd_price_per_piece, digits = 2), ')')
    ) |>
    dplyr::select(!dplyr::starts_with('sd_')) |>
    dplyr::rename(Year = year,
                  `Number of sets` = n,
                  `Sets with price` = n_valid,
                  `Pieces per set` = mean_pieces,
                  `Set price` = mean_price,
                  `Price per piece` = mean_price_per_piece) |>
knitr::kable(caption = 'Summary of Lego cost by year.', digits = 2)| Year | Number of sets | Sets with price | Pieces per set | Set price | Price per piece |
|---|---|---|---|---|---|
| 2000 | 333 | 11 | 115.73 (276.49) | 6.99 (1.9) | 0.24 (0.26) |
| 2001 | 354 | 6 | 113.77 (240.75) | 7.99 (6) | 0.09 (0.02) |
| 2002 | 383 | 7 | 135.78 (257.39) | 44.85 (99.32) | 0.15 (0.09) |
| 2003 | 351 | 3 | 189.16 (332.72) | 7.49 (4.33) | 0.11 (0.06) |
| 2004 | 366 | 4 | 166.08 (264.2) | 9.99 (8.68) | 0.36 (0.43) |
| 2005 | 344 | 34 | 220.91 (376.92) | 40.2 (51.99) | 0.3 (0.27) |
| 2006 | 278 | 77 | 290.68 (356.29) | 43.97 (41.92) | 0.2 (0.21) |
| 2007 | 242 | 154 | 362.94 (536.53) | 38.13 (49.2) | 0.15 (0.18) |
| 2008 | 289 | 192 | 317.45 (521.95) | 36.88 (43.59) | 0.18 (0.18) |
| 2009 | 311 | 204 | 279.32 (386.71) | 38.98 (42.56) | 0.19 (0.19) |
| 2010 | 361 | 234 | 270.04 (478.22) | 34.36 (49.35) | 0.21 (0.18) |
| 2011 | 416 | 283 | 223.77 (372.41) | 29.63 (40.35) | 0.24 (0.19) |
| 2012 | 520 | 270 | 195.87 (327.53) | 33.77 (35.61) | 0.2 (0.17) |
| 2013 | 509 | 293 | 238.45 (396.21) | 42.75 (75.83) | 0.2 (0.18) |
| 2014 | 562 | 330 | 236.62 (379.14) | 36.24 (40.48) | 0.17 (0.17) |
| 2015 | 627 | 366 | 244.63 (511.87) | 37.96 (42.32) | 0.17 (0.16) |
| 2016 | 660 | 378 | 245.72 (507.2) | 39.53 (53.65) | 0.18 (0.18) |
| 2017 | 636 | 368 | 283.4 (592.64) | 45.31 (65.66) | 0.16 (0.16) |
| 2018 | 643 | 373 | 269.88 (525.66) | 40.71 (54.36) | 0.16 (0.17) |
| 2019 | 624 | 337 | 303.71 (526.29) | 49 (64.58) | 0.16 (0.16) |
| 2020 | 657 | 374 | 321.99 (669.84) | 52.42 (72.18) | 0.17 (0.17) |
| 2021 | 696 | 399 | 391.94 (869.1) | 57.95 (83.88) | 0.16 (0.16) |
| 2022 | 633 | 375 | 450.19 (826.19) | 67.1 (84.09) | 0.15 (0.14) |
| 2023 | 695 | 393 | 436.05 (741.25) | 67.71 (81.82) | 0.14 (0.13) |
| 2024 | 714 | 423 | 469.07 (713.58) | 69.64 (72.86) | 0.13 (0.13) |
| 2025 | 799 | 457 | 484.73 (772.39) | 77.95 (89.01) | 0.14 (0.14) |
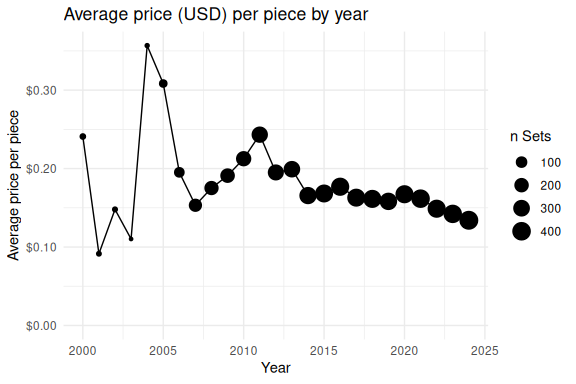
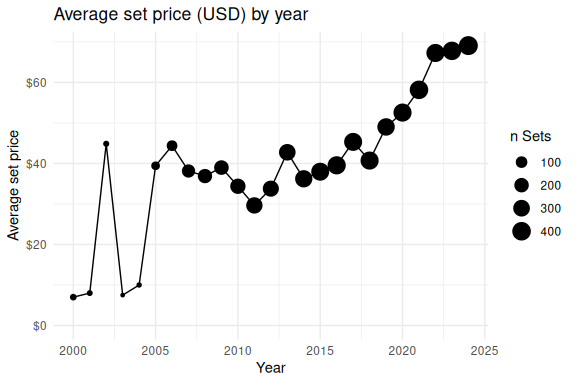
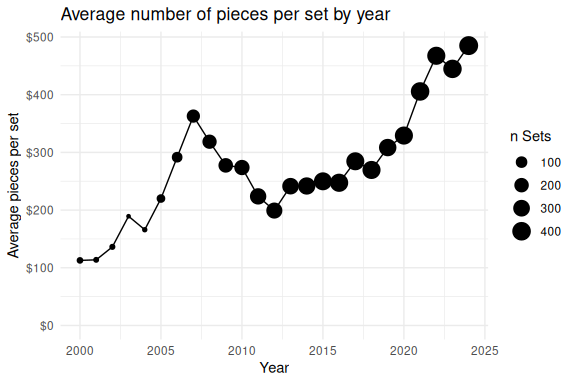
Figures 2 and 3 summarize the mean price per piece and mean price per set, respectively. As can be seen the average price per pieces has been relatively stable averaging around $0.18 per piece. However, the average price per set has risen to nearly $70 per set in 2024 from $40 in 2016. This can largely be explained by the fact that Lego sets have been getting larger over the last decade (see Figure 4).
ggplot(lego_summary, aes(x = year, y = mean_price_per_piece)) +
    geom_path() +
    geom_point(aes(size = n_valid)) +
    scale_size('n Sets') +
    scale_y_continuous(labels = scales::dollar_format(prefix="$")) +
    expand_limits(y = 0) +
    ylab('Average price per piece') + xlab('Year') +
    ggtitle('Average price (USD) per piece by year')
Figure 2: Average price (USD) per piece by year.
ggplot(lego_summary, aes(x = year, y = mean_price)) +
    geom_path() +
    geom_point(aes(size = n_valid)) +
    scale_size('n Sets') +
    scale_y_continuous(labels = scales::dollar_format(prefix="$")) +
    expand_limits(y = 0) +
    ylab('Average set price') + xlab('Year') +
    ggtitle('Average set price (USD) by year')
Figure 3: Average set price (USD) by year.
ggplot(lego_summary, aes(x = year, y = mean_pieces)) +
    geom_path() +
    geom_point(aes(size = n_valid)) +
    scale_size('n Sets') +
    scale_y_continuous(labels = scales::dollar_format(prefix="$")) +
    expand_limits(y = 0) +
    ylab('Average pieces per set') + xlab('Year') +
    ggtitle('Average number of pieces per set by year')
Figure 4: Average set price (USD) by year.