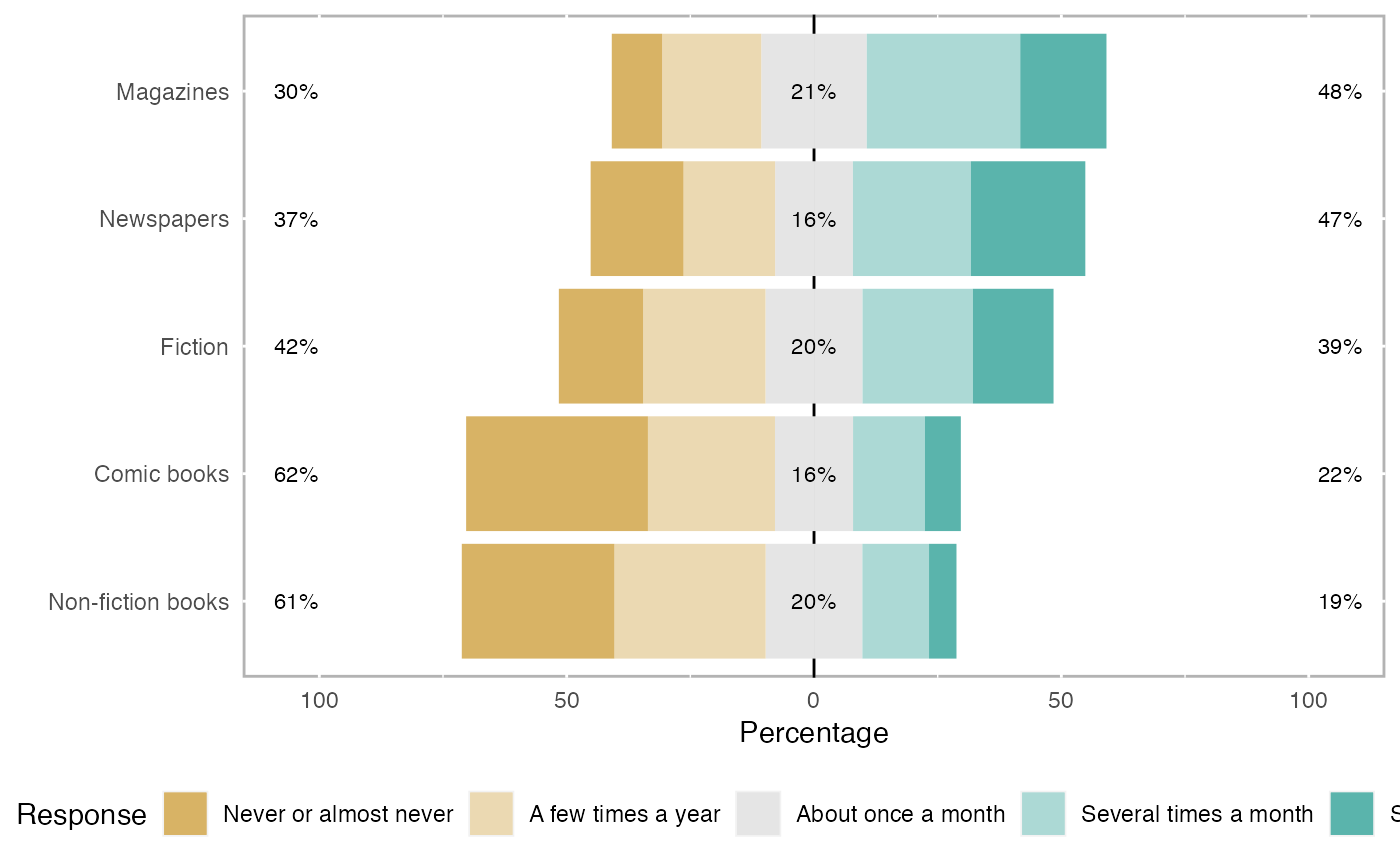
This function will provide various statistics about a set of likert items. The resulting object will have the following items:
likert(items, summary, grouping = NULL, factors = NULL, importance, nlevels)Arguments
- items
data frame containing the likert based items. The variables in the data frame should be factors.
- summary
a pre-summarized data frame. The first column must be the items and the remaining columns are the levels (e.g. strongly disagree, disagree, etc).
- grouping
(optional) should the results be summarized by the given grouping variable.
- factors
a vector with
length(factors) == ncol(items)defining which factor each column belongs to. The values correspond to the factor label.- importance
a data frame of the same dimensions as items containing an importance rating for each item. The order of columns should match and the names from items will be used.
- nlevels
number of possible levels. Only necessary if there are missing levels.
Value
a likert class with the following elements: results, items, grouping, nlevels, and summary.
Details
results- this data frame will contain a column 'Item', 'Group' (if a grouping variable was specified, and a column for each level of the items (e.g. agree, disagree, etc.). The value within each cell corresponds to the percentage of responses for that level and group.items- a copy of the original items data frame.grouping- a copy of the original grouping vector.nlevels- the number of levels used in the calculations.
See also
plot.likert
summary.likert
Examples
data(pisaitems)
items29 <- pisaitems[,substr(names(pisaitems), 1,5) == 'ST25Q']
names(items29) <- c("Magazines", "Comic books", "Fiction",
                   "Non-fiction books", "Newspapers")
l29 <- likert(items29)
summary(l29)
#>                Item      low  neutral     high     mean       sd
#> 1         Magazines 30.21689 21.33091 48.45219 3.254813 1.245086
#> 5        Newspapers 37.29377 15.72688 46.97935 3.140282 1.442299
#> 3           Fiction 41.77380 19.61739 38.60882 2.961111 1.342667
#> 2       Comic books 62.43096 15.78368 21.78536 2.298768 1.292631
#> 4 Non-fiction books 61.42466 19.55493 19.02042 2.322898 1.199176
plot(l29)
